Pivoting and Unpivoting Data in Power BI: A Comprehensive Guide To New Learners
Welcome to the world of Business Intelligence, where data transformation skills are essential to every data analyst.
Today, we’re diving into the fascinating processes of pivoting and unpivoting data. Whether you’re a data enthusiast or a business analyst, mastering these techniques will elevate your data manipulation skills and make your reports more insightful and dynamic.
Today we will explore the concepts of Pivoting and Unpivoting in Microsoft Power BI, where you can learn about the appropriate usage and applications of it in transforming your data.
Whether you just start learning Power BI concepts or just exploring this tool for a first time, this article will give you some ideas and concepts for you. So grab some coffee, sit back, relax and let's explore with us!

What is Pivoting in Power BI?
Pivoting in Power BI is the process of transforming rows into columns. This is particularly useful when you want to summarize data and make it more readable.
For example, if you have sales data for different regions and months, pivoting can help you create a table where each region is a column, and each row represents a month.
Real-World Case Study: Sales Data Analysis
Ok, to better understand this concept, let's shall now explore with some case study.
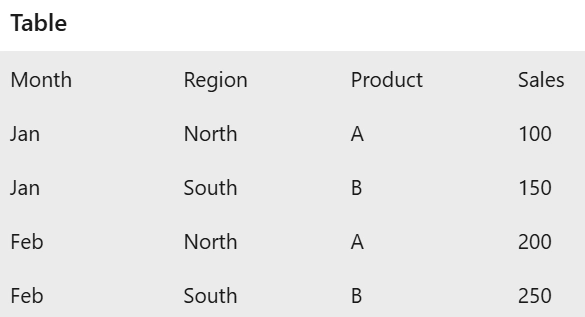
Imagine you work for a retail company and have a dataset with sales figures for different products across various regions and months. By pivoting this data, you can create a summary table that shows the total sales for each product in each region, making it easier to compare performance across regions.
Explore the below two figures where Figure 1 is then pivoted to transform into Figure 2.

Figure: Original Sales Table

Figure: Pivoted Sales Table
Then, what is Unpivoting in Power BI?
Unpivoting is the reverse process of pivoting. It transforms columns back into rows. This is useful when you have data in a wide format and need to convert it into a long format for analysis.
For instance, if you have a table where each column represents a month and each row represents a product, unpivoting can help you create a table where each row represents a product-month combination.
To better get this concept, let us explain with some real-case study as below.
Real-World Case Study: Survey Data Analysis
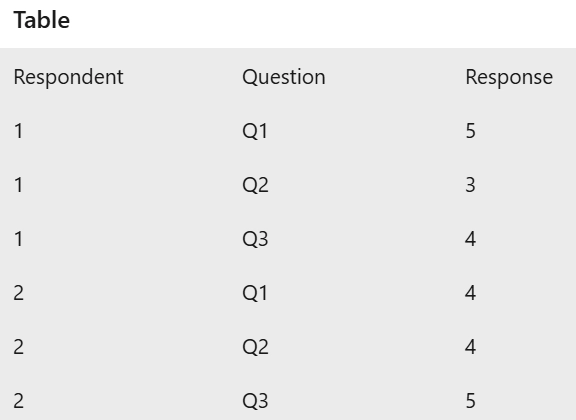
Consider a scenario where you have survey data with responses recorded in columns for each question. Unpivoting this data can help you transform it into a format where each row represents a single response to a question, making it easier to analyze trends and patterns.

Figure: Original Survey Data Table

Figure: Pivoted Survey Data Table
Some common pitfalls to avoid before applying Pivoting or Unpivoting features in Power BI!
While pivoting and unpivoting are powerful features, there are some common pitfalls to be aware of:
1. Data Integrity Issues:
Ensure that your data is clean and consistent before pivoting or unpivoting. Inconsistent data can lead to incorrect results.
2. Performance Concerns:
Large datasets can slow down the pivoting and unpivoting process. Consider optimizing your data model to improve performance.
3. Loss of Granularity:
Pivoting can sometimes lead to a loss of detailed information. Make sure you retain the necessary granularity for your analysis.
4. Incorrect Data Types:
Ensure that your columns have the correct data types before performing these transformations to avoid errors.
CONCLUSION
Pivoting and unpivoting are essential techniques in Power BI that can help you transform your data for better analysis and insights. By understanding how to use these features effectively and avoiding common pitfalls, you can enhance your data analysis skills and make more informed decisions.
If you’re interested in mastering Power BI and learning more about these techniques, consider enrolling in our Power BI courses. Our comprehensive curriculum is designed to help you become proficient in data analysis and visualization, empowering you to unlock the full potential of your da


